There’s little doubt that video streaming is on the rise, largely as streaming devices become standard fare for consumers seeking diverse content options. This trend notwithstanding, unseating traditional TV watching—live and time-shifted—as the dominant medium across the U.S. remains a real challenge.
On a typical day, 93% of streamers watched traditional TV, as detailed in the latest Nielsen Local Watch Report. While the average streaming viewer aged 25-54 consumed two hours and 28 minutes of over-the-top (OTT) content per day, 47% of those streamers only watched traditional TV on a typical day, 46% consumed a mix of traditional TV and streaming, while only 7% streamed exclusively.
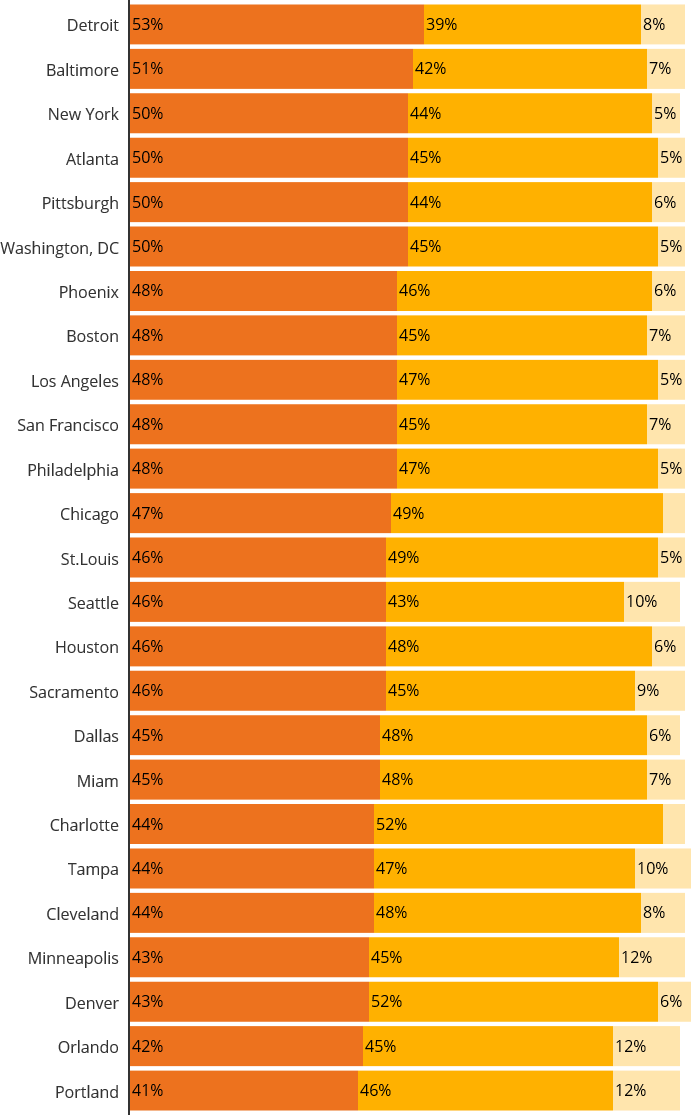
When it comes to daily TV usage among streamers in the largest TV viewing markets*, 53% watch only traditional TV in Detroit in an average day, while 39% use a mix of both traditional TV and a streaming device. Eight percent use only a streaming device in a typical day. Meanwhile, in Portland, 41% of streamers watch only traditional TV in an average day, with 12% only using a streaming device to view content. Forty-six percent use a combination of traditional TV and a streaming device in an average day.
DAILY TV USAGE AMONG STREAMERS IN LPM MARKETS

TV Only TV & Streaming Device Streaming Device Only
Read as: Fifty-three percent of TV streamers in Detroit watched only traditional TV during an average day in Nov’17. Thirty-nine percent used a mix of both traditional TV and a streaming device. Eight percent of streamers used a streaming device exclusively in an average day.
Source: Nielsen NPower, Average Daily Reach Among – Persons 25-54, Excludes BBO Homes, November 2017
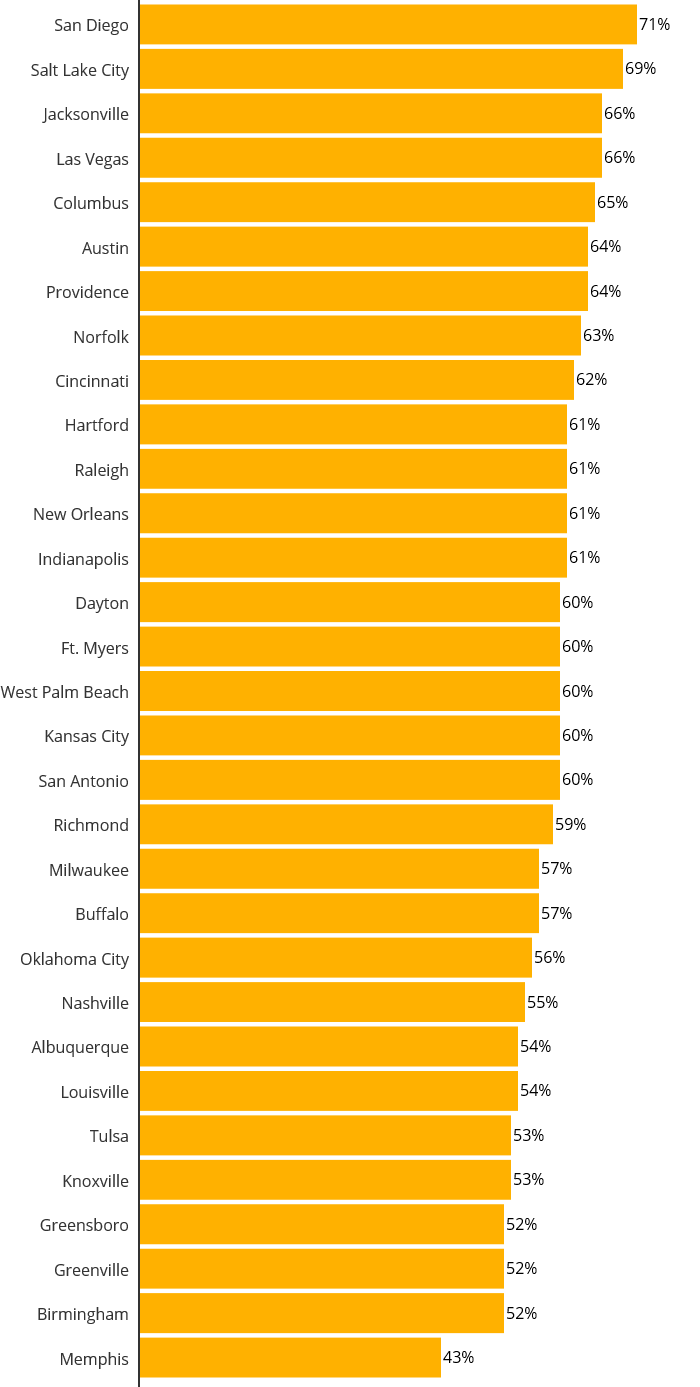
As of November 2017, over 65 million U.S. homes owned an enabled device capable of streaming content to the TV. That’s a big number, and it continues to grow. While 59% of U.S. homes are streaming enabled, the story varies by market. With “OTT-savvy” homes more likely to be in urban areas, mid-size markets are showing more growth. San Diego is currently winning the race, with 71% of homes having access to an enabled streaming device.
STREAMING DEVICES IN SET METER MARKETS
Percent of homes that own an enabled streaming device:

Read as: Seventy-one percent of homes own an enabled streaming device in San Diego.
Source: Nielsen Npower, November 2017, TV Households (excludes BBO homes), Streaming Device Home = Access to Internet Enabled Game Console, Smart TV or Internet Connected Device (Roku, Google Chromecast, Amazon Fire or Apple TV)
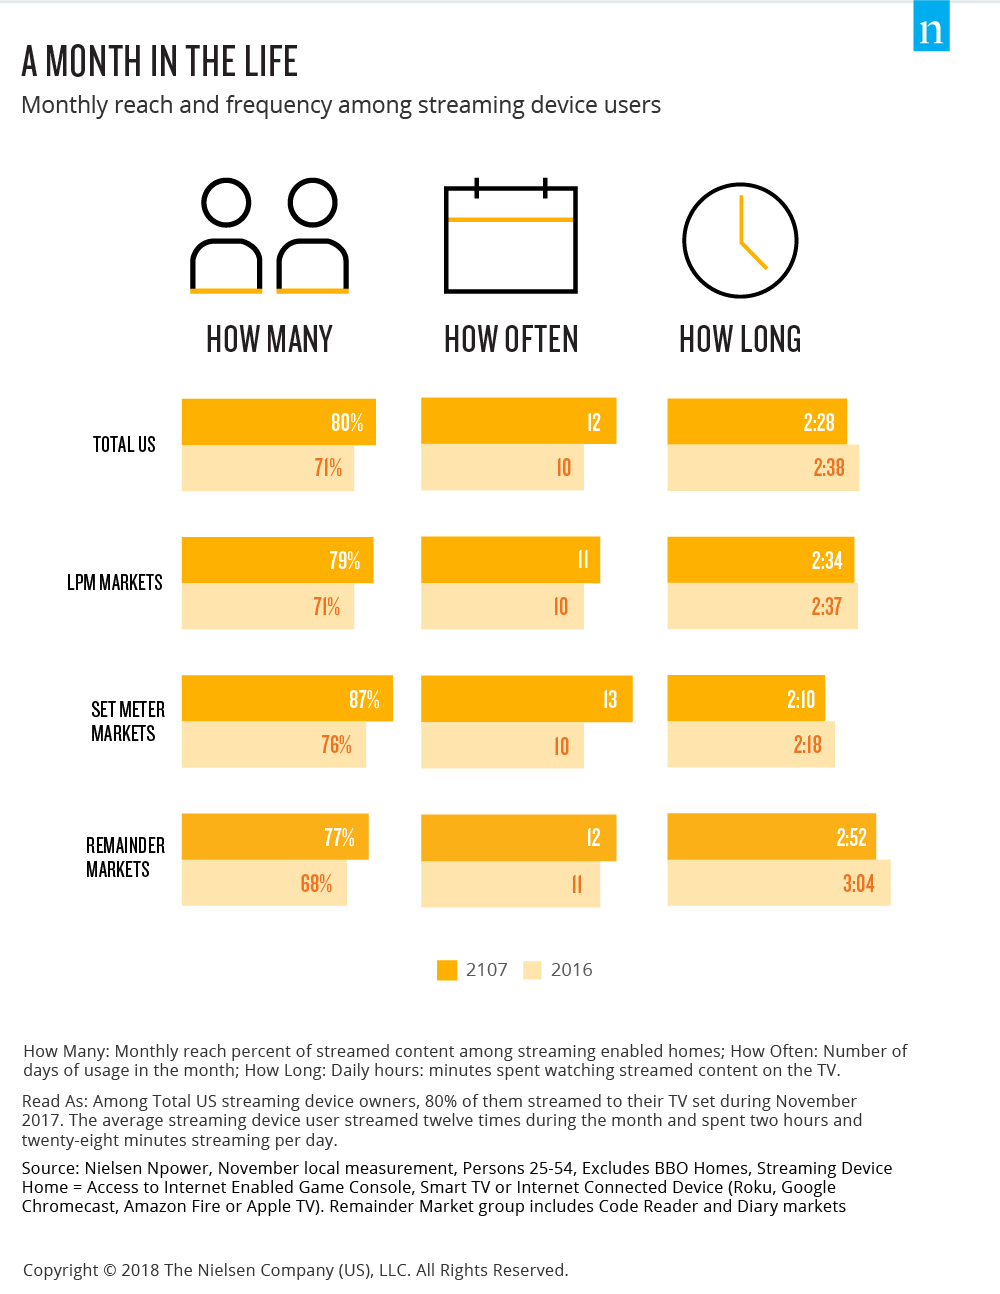
When looking at TV streaming frequency among American streaming device users aged 25-54, the average user streamed content twelve days during the month of November 2017. On average, they streamed for two hours and 28 minutes per day.

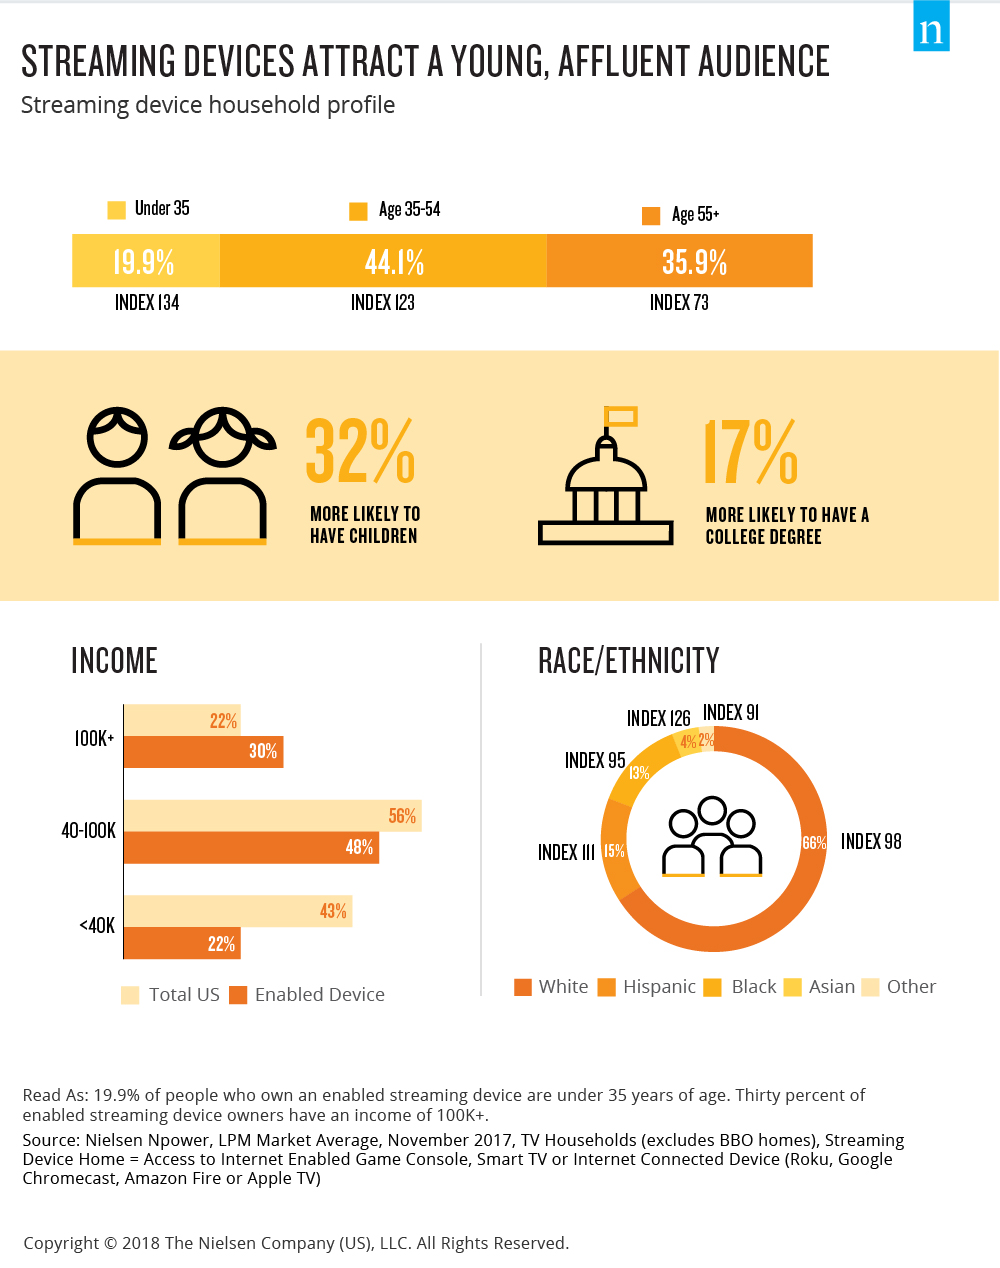
Streaming devices attract a young, affluent audience. For example, homes where the head of house is less than 35 years old are 34% more likely to have a streaming device than the average home. This group accounts for 20% of streaming device owners. Persons aged 25-54 comprise 44%, and ages 55+ make up 36%.
Homes with streaming devices are 32% more likely to have children and 17% more likely to include people who have a college degree. They are also high-income producers, with 30% earning more than $100,000 vs. 22% of the total U.S. population. Streaming device homes are also ethnically diverse: 65% are White, 15% are Hispanic and 13% are Black.

Lastly, local media also has powerful reach potential with streamers. According to Nielsen Scarborough, 91% of streaming device owners access local media on TV or online. Fifty-one percent of streamers have watched local news, 51% have used an internet app on a mobile device to access local news, 43% have used an internet app to access local or internet radio in the past month, and 40% completely or somewhat agree that it’s important to use social media sites for local information.
As the average American now has more ways than ever to view content, the resilience of traditional programming is impressive in today’s digital age. Even the heaviest of streamers finds something to engage with on broadcast TV. A true story in Nielsen data, reaffirming the powerful reach and relevance of local media in our daily lives.
Notes:
Markets Nielsen measures using its local people meter (LPM)
Methodology
The insights in this article were derived from:
- Nielsen Local Watch Report – Viewing in November 2017
- Markets Nielsen measures using its local people meter (LPM)
