Consumers today have access to an entire universe of content at their fingertips. Yet while the media landscape expands, the type of content consumers are spending time with has remained fairly consistent. Ad-supported content remains the medium that consumers gravitate toward the majority of the time in their viewing habits.
CONSUMERS TIME SPENT VIEWING AD-SUPPORTED CONTENT REMAINS STEADY
Percent Share of Time Spent Viewing
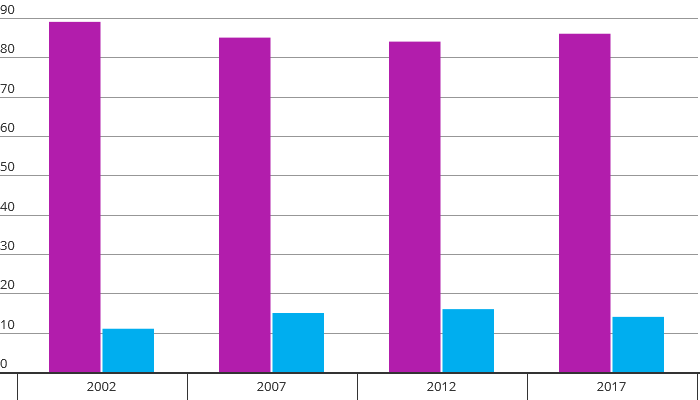
Ad Supported Non- Ad Supported
According to Nielsen data, the share of time spent with ad-supported content on platforms (such as TV, radio, smartphones, video games and tablets) for adults in 2017 was 86%—a number that’s remained relatively flat over the past decade. In 2002, when avenues of consumption were mainly via television and radio, ad-supported content accounted for an 89% share of consumers’ time spent.
These statistics have even more significance when considering the availability of different devices over time and the ultimately substantial growth in time spent with media overall. Engagement with ad-supported content has kept pace while more and more devices have been introduced into the media ecosystem.
Media Device Ownership
| (% of Total U.S. Homes) | 2002 | 2007 | 2012 | 2017 |
| TV HH | 98 | 98 | 96 | 96 |
| Smartphones | 89 | |||
| PC Owner w/ Internet | 71 | 79 | 81 | |
| DVD | 88 | 84 | 69 | |
| Tablet | 19 | 64 | ||
| Subscription Video on Demand (SVOD) | 62 | |||
| DVR | 22 | 47 | 55 | |
| Video Game | 38 | 45 | 42 | |
| Multimedia Device | 36 | |||
| Enabled Smart TV | 34 | |||
| VCR | 90 | 70 | 36 | 0.2 |
While 96% of U.S. homes have a television, other devices are slowly reaching ubiquity as well. Although the rate of penetration for PCs has slowed, these devices can still be found in 80% of U.S. TV homes. Meanwhile, tablet and smartphone penetration levels have quickly grown to 64% and 89%, respectively. Subscription video on demand (SVOD) services have surpassed penetration levels of their time-shifted brethren, the DVR. In regards to other newer platforms, about two-thirds of homes have an internet-enabled connected device capable of streaming content to a television set, which includes enabled smart TVs, multimedia devices and video game consoles.
Engagement with ad-supported content has remained strong despite such high adoption rates for so many devices, in part because consumers’ time with media hasn’t remained a finite resource. In fact, the amount of time consumers are allocating toward media is expanding, increasing by more than 25 hours between 2002 and 2017. Time spent with ad-supported content has grown and maintained a consistent ratio with overall time spent.
WEEKLY TIME SPENT WITH MEDIA

Ad Supported Non- Ad Supported
Consider this, in second-quarter 2007, the average amount of time spent with media among adults was just over 50 hours per week. In second-quarter 2017, that number increased to over 75 hours per week, nearly 65 hours of which are spent with ad-supported platforms. Since second-quarter 2012, the average amount of time spent with ad-supported TV, radio, and digital platforms has grown by over 15 hours—an increase of 30% to 2017. When looking as far back as second-quarter 2002, that same number exceeds 20 hours.
Although consumption of ad-supported media has varied over the past 15 years, it is still far more dominant and successful than perception may indicate. Today, ad-supported content remains consumption stalwart as consumers’ media palates expand and consumption habits swell. While such revenue models have existed for some time, they seemingly have the versatility and adaptability to keep pace with an ultimately dynamic and fragmented landscape. This new age of media consumption allows marketers and advertisers to reach consumers in more ways than ever before and do so with ease.